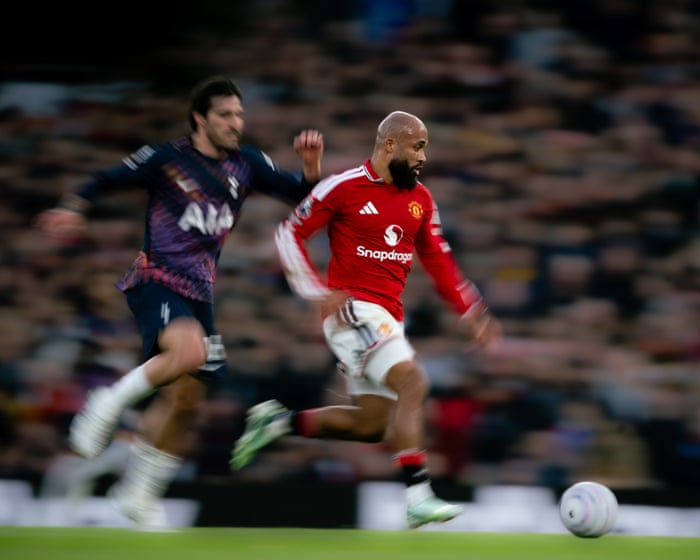
It was predictable. Manchester United dropped points against Tottenham, and critics quickly questioned their effort and commitment, using the team’s physical statistics to support their arguments. Speaking on Sky Sports, Jamie Redknapp said: “There’s a pattern I don’t like when I watch teams, and that’s when – and the stats don’t lie – the other team runs more than you. In the Premier League right now, I feel there are a couple of non-negotiables: you have to run more than the other team if you want to win, or at least get close enough that it doesn’t make much difference. Tottenham ran five kilometres more than Manchester United.”
Physical metrics like distance run and number of sprints are increasingly accessible and easy to understand, so they have become widely used. It has become a common theme that when a big club fails to meet expectations, pundits and commentators turn to their running metrics in search of a single catch-all explanation. Liverpool and Chelsea faced similar criticism last season. But is it fair? How much of a correlation is there between a team running a lot and that team being successful? While the numbers may not seem complex at first glance, answering this question is, which probably shows that such metrics are so nuanced in a team sport that it probably isn’t best practice to attach too much significance to the top-line figures.
The first way we can assess this is by comparing the Premier League table to the rankings for distance run and high-intensity distance. Yes, this is pretty simple and basic, but it’s a place to start. Last season’s Premier League table hardly mirrors the rankings for distance covered or high-intensity distance per game. Sure, Arsenal and Manchester City were high for overall distance, but the teams who came third to eighth had middling – at best – outputs in this respect. View image in fullscreen. The teams that finished in the top 10 averaged 4,363km over the season; the teams in the bottom 10 averaged 4,332km. In the grand scheme of things, a difference of 31km between those averages is rather small. Again, there’s a slight difference between the average high-intensity distance for top-10 teams (338.7km) and those in the bottom 10 (328.4km), but we’re talking about an increase of 3%. Similarly, when looking at data from this season, it’s difficult to see much of a link. View image in fullscreen.
Looking at it in relation to the table does ignore that success is relative, however. Of course Burnley were not going to finish seventh in the table just because they came seventh in the distance rankings. Instead, we can use the Opta supercomputer’s pre-season predictions to give us an idea of what a successful campaign might have looked like for all clubs and whether there was a trend of overachieving teams running more. Ten teams in the Premier League last season finished at least one place higher than their likeliest final place according to the Opta supercomputer in pre-season, and they averaged 4,369km over the season; the nine clubs that finished at least a place below their likeliest final position averaged 4,308km. So again, there is a difference, it’s just very small at 1.4%. However, Sunderland (+13 places) and Manchester United (+9 places) weren’t in the top 10 for distance covered but exceeded the supercomputer’s expectations to a greater degree than any other team; Crystal Palace (-8 places) and Newcastle (-6 places) were in the top 10 for ground covered but among the most disappointing teams relative to pre-season expectations. View image in fullscreen.
We can also look at expected points, a model that simulates the goals scored by each side in each match based on the xG value of all shots and then simulates every game 10,000 times to determine the proportion of fixtures that end with a win, draw or defeat. It isn’t perfect because it’s limited by the natural pitfalls of xG, but it does give a decent barometer of performance over a season. The teams that ranked in the bottom half for distance covered last terTeams that finished in the bottom half exceeded their expected points (xPts) by 0.38 on average, while teams in the top half earned 1.88 points fewer than their xPts. In short, there seems to be very little connection between long-term success (at least as we’ve tried to measure it) and running distance.
But that doesn’t mean we found no correlations at all. When analysing a range of physical metrics over the 2025-26 season, the one most strongly linked to the final standings was distance covered in possession.
Chelsea are the Premier League’s most fun team but is it sustainable? Read more
It isn’t a perfect relationship, but there is a hint of a correlation between running more distance with the ball and finishing higher in the table. That doesn’t necessarily mean a team finished high because they ran more in possession; it likely reflects that side having more of the ball thanks to having better players. Still, it felt worth noting.
But perhaps the strongest link between physical metrics and success shows up at the game level rather than over a full season. Since the start of last season, there have been 86 instances in the Premier League where a team covered at least 5km less than their opponents in a match. In those 86 games, the side that ran at least 5km less won 10 times, and seven of those were expected wins according to the Opta supercomputer. That’s a win rate of 11.6%.
Now, there are some obvious caveats. Most importantly, 20 of these games involved at least one team having a player sent off, which can clearly have a big impact on both teams’ physical output.
Excluding those 20 games, we’re left with eight wins for the team that covered at least 5km less than their opponents out of 66 matches; that means the win rate rises from 11.6% to a massive … 12.1%.
View image in fullscreen
When we adjust the parameters to look at instances where one team covered between 2.5km and 4.99km less than their opponents (again excluding games with a red card), the win rate improves to 25.8%, though that’s still not especially high. The loss rate is 46%.
This suggests some relationship between the most extreme examples of outrunning the opposition and winning. But we shouldn’t jump to conclusions; we can’t be certain the extra running is any more decisive than a whole range of other factors.
Physical metrics are also often closely tied to playing style, so one team’s output in a match can directly affect their opponent’s. Many people like to rely on these figures probably because, on the surface, they’re simple to understand and very easy – rightly or wrongly – to attribute to effort, especially if you’re talking about a team that lost.
But the fact that there’s no strong correlation between distance run over a full season and success arguably suggests the answer over the long term isn’t to run your team into the ground, but rather to know when to raise the intensity for maximum effect.
View image in fullscreen
Jürgen Klopp perhaps summed it up best at the very start of his Liverpool reign. “We don’t have to run 115km per match to be successful. You don’t have to run like crazy if you have the ball. It is only the start. We must know how to turn the screws at the right moment; better thinking, better timing. But if we play a much better team and you are not ready to run more than them, then you are crazy.”
Pep Guardiola added to that in his final season at Manchester City. “It’s about when you have to run. Running just to run? I can go to the track and ask the marathon guys to play for us. It’s not about that, it’s when you have to do it. Last season when some players ran it was useless. The most important thing is the combination of both things.”
Intent and timing. When the going gets tough, intent potentially overrides everything else in the eyes of the average fan. To be seen as lacking effort, whether that reflects reality or not, is a cardinal sin.In a struggling football team, “just run more” is rarely the answer. This is an article by Opta Analyst.
Frequently Asked Questions
FAQs Do Premier League Teams Really Need to Run More to Win Games
1 Do Premier League teams really need to run more to win games
Not necessarily Running more isnt automatically better What matters is how and when you run Teams that run smart pressing at the right moments and covering space efficiently often beat teams that just rack up distance
2 How far does a Premier League player run in a match
Usually around 1013 km per game Goalkeepers run far less often 45 km
3 Which team runs the most in the Premier League
It changes season to season but teams that press aggressively tend to top the distance charts Interestingly they dont always finish near the top of the table
4 Has running distance increased in the Premier League over time
Yes but not as much as people think Total distance has risen slightly while highintensity running sprints and fast runs has increased a lot more
5 Whats the difference between distance covered and highintensity running
Distance covered is total ground covered in a match Highintensity running means sprinting or running fast The second one matters far more for winning games
6 Do teams that run more win more
No Studies show almost no link between total distance covered and league position Some relegationthreatened teams run the most because theyre chasing the ball
7 Why do losing teams sometimes run more
Because theyre chasing If you dont have the ball you have to run to get it back Teams that dominate possession often run less because they control the game
8 So what kind of running actually helps teams win
Sprinting highintensity pressing and smart offtheball movement A welltimed sprint to press a defender can be worth more than several kilometers of jogging
9 What is pressing and why does it involve so much running
Pressing means closing down opponents quickly to win the ball back It requires short explosive runs often many of them rather than long slow ones
10 Is running more a sign of a hardworking team
Not always It can be